Whether you’re advertising on Facebook, LinkedIn or Google, there is no shortage of metrics you can use to measure the success of your ads. While this is a great feature to have, it also makes it easy for some to get lost.
Part 1 of this guide explained what tools to use for the job when it comes to running digital ads for your company. Now we’ll go over how to make sure a) those tools are working well and b) where to look to make them work even better.
Before we begin: Know your metrics
One metric you should track as a B2B marketer is of course conversions, specifically lead form fills. But since conversion metrics (such as cost-per-conversion or conversion rate) are heavily dependent on your company’s average transaction value and sales volume, we’re going to focus on metrics you can use to improve those conversions regardless of what space you’re in.
In terms of campaign objectives on the platforms, we will stick to the main two that Gorilla utilizes: brand awareness and website visits/conversions.
Paid social (LinkedIn & Facebook)
CPM
How it’s calculated: Total spend on your ad per 1,000 impressions.
What it really means: On paid social platforms an impression is generated once a user stops on an ad and actually gives it some attention. While this may seem minor, it is a huge indication on if your ad is grabbing the user’s attention quickly before they keep scrolling on their feed.
This metric is most relevant when using the brand awareness objective. If your campaign objective is conversion based, your CPM will naturally be much higher and not really a key metric you want to be paying attention to.
On LinkedIn this metric can vary dramatically depending on how niche your industry is, but on Facebook you should shoot for under $5 for a brand awareness campaign. A good CPM is more dependent on the imagery than copy. Make sure your image and your image headline scream to the user that your ad is for them based on their profession.
Frequency
How it’s calculated: How often an audience member sees that specific ad unit on average in a given time range.
What it really means: Pretty simple here: Is your audience receiving your message enough times to have them remember you. For this you want to shoot for around at least 3x a month per ad, and max around 10x per month. Any lower and the message won’t stick, any higher and your audience will feel spammed.
If you are too high or low, look at your campaign budgeting along with your audience size to try and drive your frequency up or down. Like CPM, this metric is more relevant for the brand awareness campaign objective.
Click-Thru-Rate (CTR)
How it is calculated: Percentage of chargeable clicks divided by impressions.
What it actually means: While the imagery is typically what makes the user stop on your ad, the copy is what sells them on clicking through to the website. On LinkedIn you want to shoot for around 1%, Facebook around 0.5%. If it is significantly lower than this, look at the copy in your ad and make sure it a) hooks the user quickly b) makes it clear you can solve a problem of theirs and c) entices them to learn more by clicking through to your site.
If the copy looks good for the product you’re selling, you may need to take another look at your audience and make sure it reflects who is most likely to be into what you’re selling.
Cost-per-click (CPC)
How it is calculated: Total amount spent on your ads divided by total number of clicks.
What it really means: CPC and CTR both reflect a lot of the same insight. If you have a low CPC, your copy is doing a great job selling the user on clicking through to your site to learn more. The main difference here is that your CPC can vary a ton depending on your industry, so if it seems high take a look at your CTR. If this looks solid, you likely just have a very niche audience that is tougher to reach on the platform.
Adjustments you can make
Once you launch your campaign, let your ads run for around three weeks before making any major adjustments.
Facebook and LinkedIn both take a bit to “learn” which content in your campaign is driving the best results best on your campaign goal, so making changes too quickly can hurt you in the long run. The same goes for making changes too often. If you make some significant adjustments to your campaign, give it at least a couple of weeks before giving the verdict on it worked or not.
Let’s say you have a campaign with 10 to 12 ads in it. Around three weeks into your campaign, go into the dashboard to see what content is working well and turn off the lowest performers in that campaign. Keep in mind what your campaign is optimized for — monitoring CPM and reach for awareness optimized campaigns and CTR/CPC for conversion optimized campaigns.
If you are noticing your entire campaign is underperforming, here’s where to look to solve that for each of the metrics above:
- CPM: If this is extremely high, make sure your audience isn’t too narrow for your budget. Also remember what an impression is —they must stop on your ad. Does your image make it clear that the ad is specifically for your audience right away?
- CTR/CPC: Here is where you analyze your copy. Does the copy hook the audience right away and explain how you can solve their problem? Also, remember Facebook hides the copy behind a fancy little “see more” button after 125 characters. If your copy doesn’t have its hook in those first 125 characters, chances are these metrics will take a hit.
Paid Search (Google)
A majority of your conversions should come from Google, as this platform has the highest intent from the user.
Given that most B2B companies have a low volume of conversions compared to their B2C counterparts, you may have to look elsewhere for insight on what’s working. Luckily Google has a plethora of other metrics you can review to make adjustments that drive more conversions for your business.
Click-Through-Rate (CTR)
How it’s calculated: Shown as a percentage, this tells you how many times your ad is being clicked per 100 impressions.
What it actually means: If you have a high CTR, your ads are likely showing at or near the top of the page. This means you’re owning that keyword for your space, which is a major win.
In the B2B space, we pay particular attention to this metric over CPC (which tends to be higher in niche industries). And keep in mind that CTR will likely fluctuate from seasonal demand for your product/service.
You want a CTR above 3% at least — if you’re not seeing that, make sure:
- Keywords, ads and landing pages are consistent across the user journey
- Ad copy clearly describes what you provide
- Your budget is in line with keyword volume
Search Impression Share
How it’s calculated: The amount of impressions that your ad delivered divided by how many times your ad was eligible to be delivered (based on the search volume of your keywords).
What it actually means: This metric can vary a ton depending on your industry/how often your keywords get searched monthly. We’ve seen accounts with an impression share around 80%, others around 15%. Both can perform well.
However, if this is dipping below, say, 10%, this essentially means you are playing Hungry Hungry Hippos for that keyword with hippos that are much larger than you (in terms of ad budget). Look into adjusting your keyword to be lower search volume/higher intent by changing the keyword match type, or making it more intent-based such as “[your product] for sale” or “[your product] pricing”.
Adjustments You Can Make
When launching a new campaign, you want to let your campaign “breathe” a little so Google’s algorithms can figure out what bidding strategy will get your account the best results. After three to four weeks of running ads, there are minor tweaks you can make to enhance the results.
The Overview section shows results based on demographics, devices, location and time. For example, you may see that 40% of your budget goes into mobile ads, while 90% of your conversions come from desktop computers (along with a much better conversion rate). Or you might see that upwards of 80% of your conversions come from males aged 25 to 45, specifically from 7 a.m. to 7 p.m. Monday through Friday.
Below is what your Overview section may look like-notice how a small fraction of our spend is coming from Computers, but a much larger chunk of our conversions is coming from that Device Category along with a much better Conversion Rate? Might be time to increase our bidding on those specific devices!
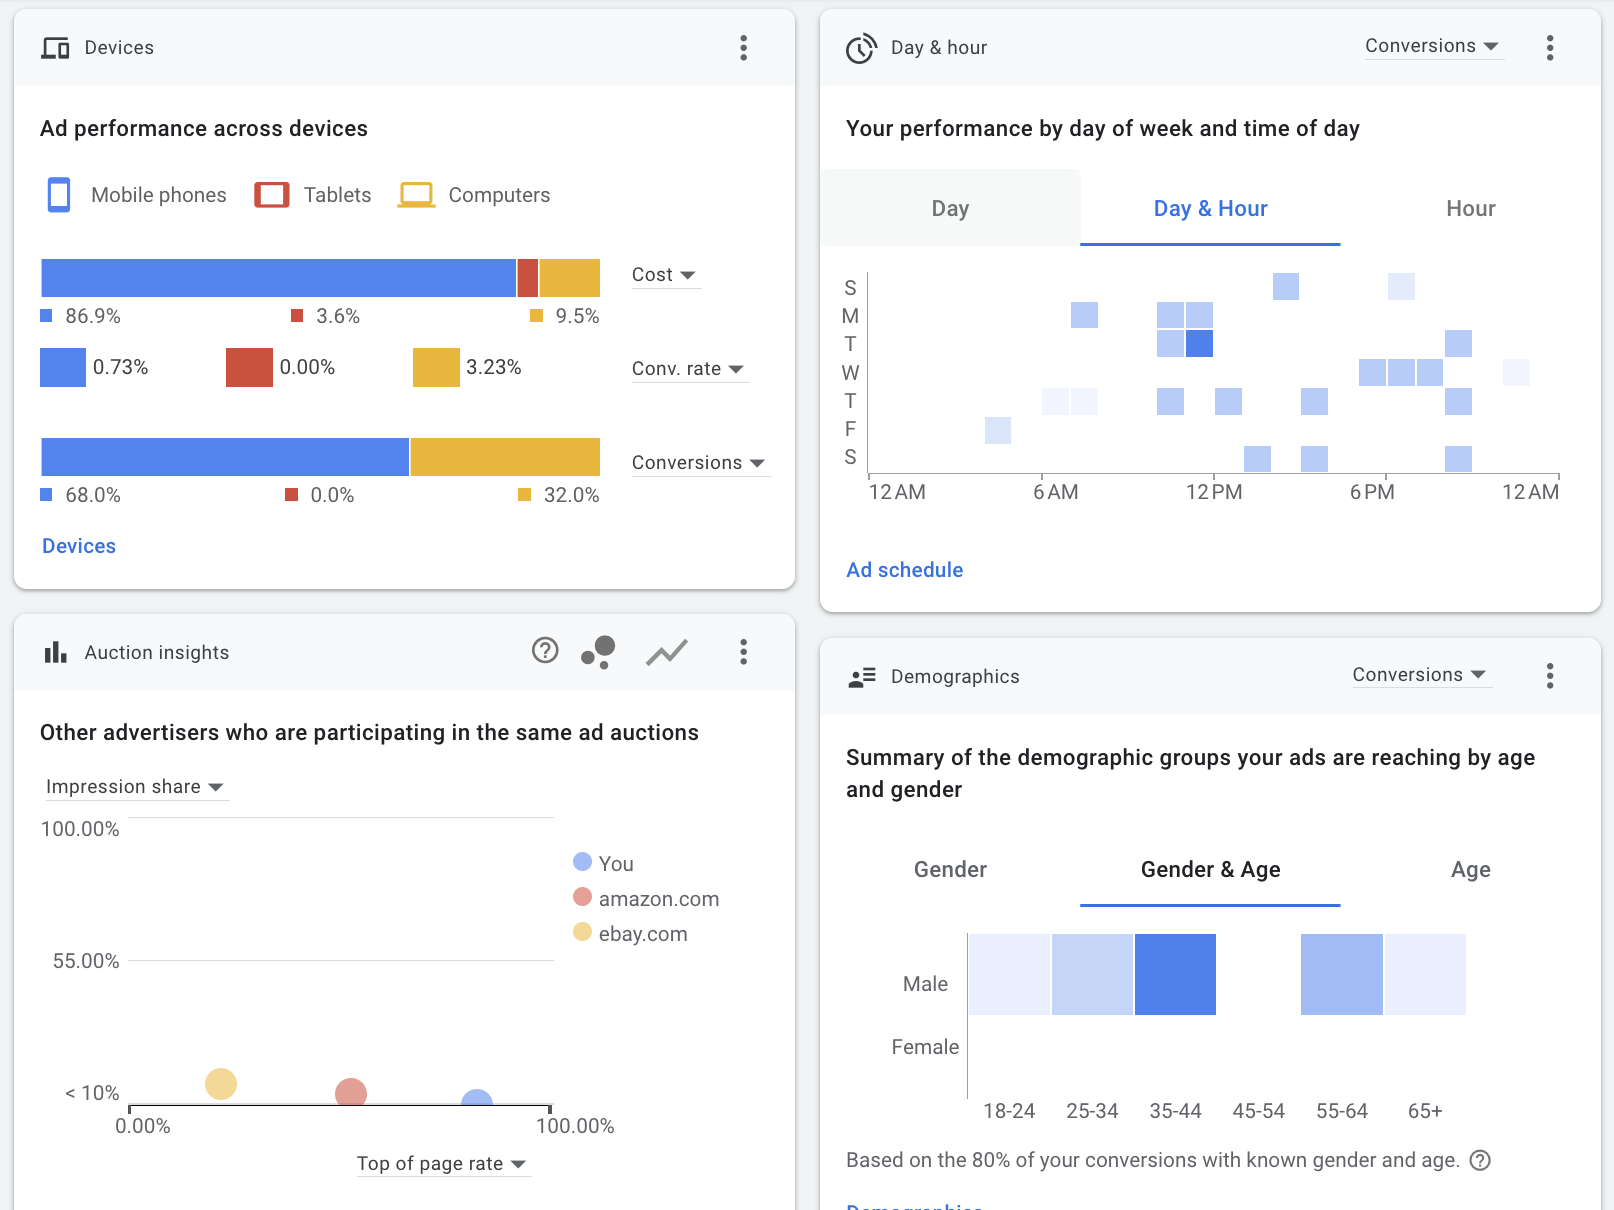
On the left side toolbar, there are sections labeled Audiences, Devices, Ad Scheduling and more. If you see you are getting more traction from certain demographics, devices or time slots, you can click into here and increase your bidding in that segment to see if it boosts your performance. We recommend increasing/decreasing bidding by only 10% to 15%, as any higher you risk bidding unnecessarily high on certain ad auctions.
Bonus section: Google Analytics 4
Google Analytics 4 (GA4) obviously is not a paid media platform. However, it offers insight on something most paid media platforms lack: what happens AFTER a user clicks through to your site. There are many reports within GA4 along with many ways to customize/filter them, but here are a couple of the basic ones that can help you the most.
User Acquisition Report
Here you can see a breakdown of how people from the different traffic sources such as Paid Search, Paid Social or Organic are interacting with your site. The main metrics to look at here are the engagement rate (% of users that actually DO something on your site once landing on it) and average engagement time (How long do they stay on the site after clicking through?). This quick video below walks you through where to find it, what you can get from the report, and also some ways you can customize it to show more specific data.
This data is important because you might generate a ton of clicks through your paid digital platforms, but if the users aren’t staying on your site and taking action, you likely need to audit your audience or creative. We’ve seen that when these two metrics are solid, the conversions typically follow.
Conversion Path Report
Under Advertising on your GA4 toolbar you’ll see an option labeled “conversion paths”. The name here kind of gives it away, as it shows you the journey users take before converting. You can see what traffic sources are driving conversions, but also how many touchpoints it took to get them there.
What I really love about this report is that if you’re running paid ads on multiple platforms, you can actually see if conversions are coming from users that interacted with an ad on one platform, then eventually converted through another. Just because you aren’t seeing direct conversions coming from a specific platform doesn’t mean it isn’t doing anything for your business. For example a user might be hit with ads on paid social a few times, then convert directly through a Google Ad. In this instance think of Paid Social as your “starting pitcher” and Google Ads as your “closer”.
Now take your toolbox and get out of here
Facebook, LinkedIn and Google are powerful tools for your business — especially now that you know what levers to pull so they’re working in your favor.
Are there other ad platforms out there? Yes. But they don’t provide nearly the same returns. Are there other helpful metrics within those platforms? Also yes. But now you have your foundation. So grab your tools and get to work.

