As we covered in part two of this series, Google Analytics 4 offers essentially an entire department store of reports and metrics for analyzing your advertising efforts.
But if you’re only viewing these at their basic level, you’re not using this platform to its fullest potential.
Part three of this series will walk you through how to get the absolute most from Google Analytics 4 by utilizing additional tools this platform offers.
The compare date range feature
This one is a complete softball, to be fair. But it genuinely boggles my brain how many digital marketers don’t use the compare feature in GA4’s (and other platforms) date range tool regularly when analyzing performance.
Whether you launched a new landing page, campaign or audience, or simply upped your spend on a certain platform, this tool is essentially an easy button for judging performance before and after the date you launched it. This way, you can see if the change you made increased sessions, engagement rate, conversions or any other metric within GA4.
And if your business experiences up/down swings due to seasonality or sees different traffic during the week vs the weekend, don’t fret. You can adjust the comparison time frame to options such as the same period from last year or have GA4 use the preceding period but matching the day of the week.
Multi-dimensional breakdowns
When viewing reports in GA4, you can use different dimensions such as channel, source, device, location, landing page and more. Think of these as the “lens” through which you look at your GA4 metrics from.
But what a lot of marketers don’t take advantage of is using more than one of these at once.
A prime example of using this feature would be to see how certain channels/platforms are performing on specific devices by using “Session Source” as the main dimension then “Device Category” as the secondary dimension for the breakdown. Your Facebook or LinkedIn campaigns might be performing alright on desktop, however their mobile performance once users get to your landing page is very subpar. You now know that the landing page for your campaign is not mobile friendly, and adjustments need to be made.
To utilize this feature of GA4, simply hit the “+” sign that appears next to the main dimension that your report is already being broken down by (by default this is “Session Default Channel Group, but there are many options to use), shown below.

Some other options for secondary dimensions are demographics, location, specific campaigns, and more!
Filtering reports
This next little “trick” isn’t as much about diving deeper into your data, but more so making it easier to visualize it (which in turn, makes it easier to dive deeper).
By utilizing GA4’s report filter and multi-dimension functions, we can easily look at just our paid social advertising’s performance between each of the device categories.
Let’s say you notice your paid social channel isn’t working quite as well as you’d like it to. In this case, you want to only view data from the channel that’s struggling — without all of the other clutter.
To do this, select the “add filter” button under the title of the report you are viewing. This will open up a pop up on the right side of your screen, where you can select to view data in that report within a specific dimension.
For this example, we’ll look only at data from paid social by filtering the “Session Acquisition” by Session Default Channel group. The data is broken down by Session Source, with the secondary breakdown being Device Category.
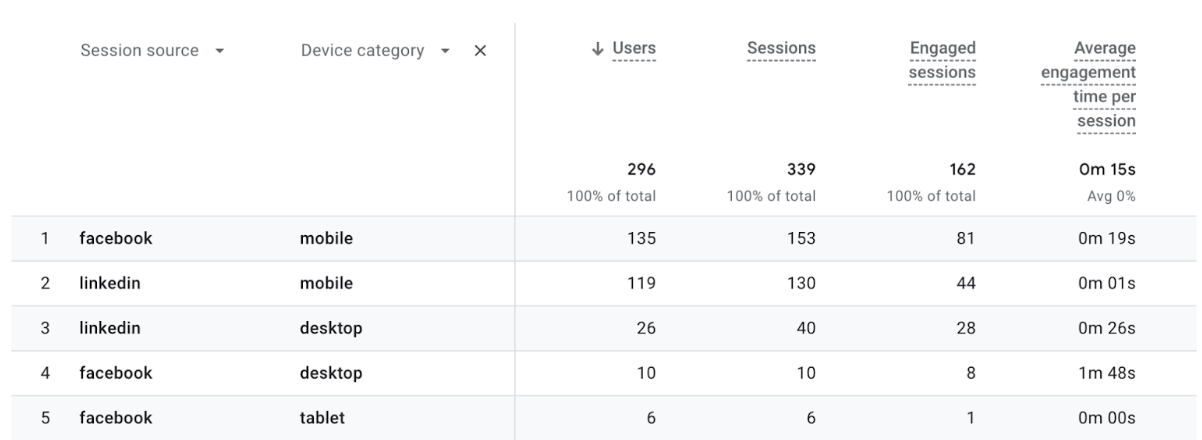
Eliminating the clutter in this report to only look at my paid social performance made it much easier to notice an issue-my Average Engagement Time on LinkedIn is very poor both on mobile and desktop. If done correctly, Average Engagement Time from your LinkedIn Ads should outweigh your Facebook ads due to Facebook being more of a volume play instead of a higher intent strategy.
Customizing reports
The first two features we’ve gone over help you look at your GA4 metrics from different angles. One more feature GA4 offers that a lot of marketers might not be utilizing is the customize reports feature.
Select the pencil icon in the top right of your screen when in a GA4 report, and it will bring up a toolbar on the right side of your screen.
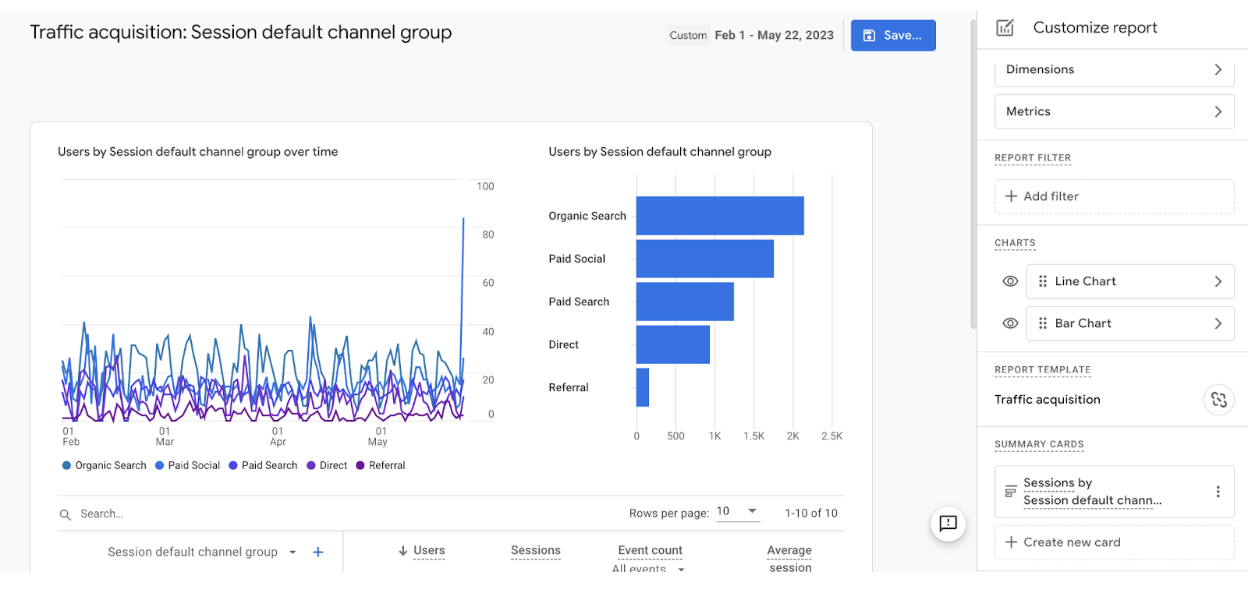
Is there another metric or dimension you wish you could view in this report? Or perhaps you’d like to see some of the data provided in the report in a different visualization option, such as a pie graph?
No matter what type of data you’re looking into or whatever metric you’d like to analyze, this feature allows you to make it happen.
Scroll depth and session duration events
Do you have landing pages that include a lead form midway down the page? Or perhaps an explainer article on your site and you’re curious how far down users are reading?
You’re in luck because through Google Tag Manager, GA4 now has the ability to provide you that information. It just takes a little technical legwork, and you’re rewarded with data worth 10x what it took to set those events up.
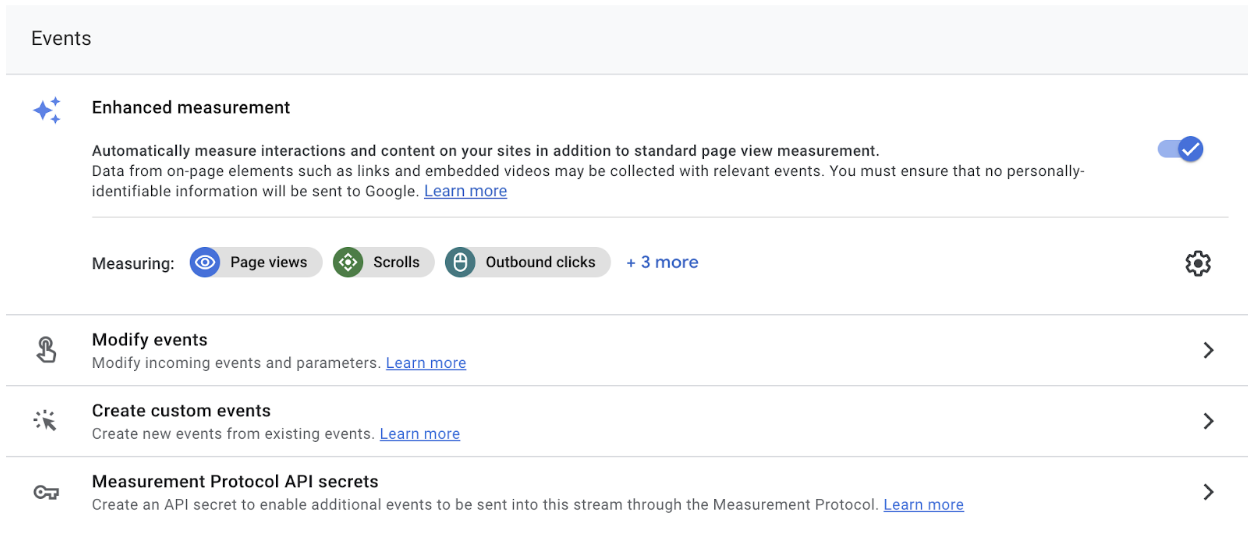
Step 1. First go to your GA4 property and go to the admin panel. Under property settings, select “Data Streams.” In the “Enhanced Measurement” section, make sure that “scrolls” is toggled on, pictured below. If not, go ahead and turn it on.
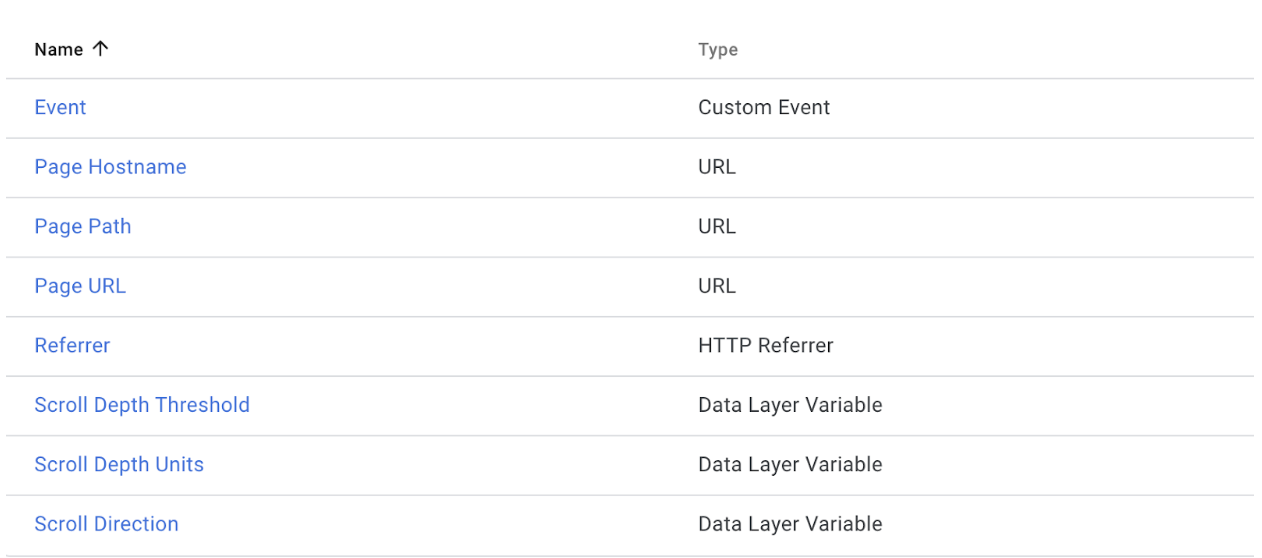
Step 2. Go to your Google Tag Manager account, and go to the variables section. Ensure that the variables labeled “Scroll Depth Threshold”, “Scroll Depth Units” and “Scroll Direction” are toggled on, pictured below.
If they are not, select the Configure button in the top right and toggle them on.
Step 3. Next you will have to set up triggers using these variables, that we will then use to make tags to fire events into your GA4 property. Here is a video walking you through how to create these triggers for both Scroll Depth and Session Duration.
Step 4. Now that we have set up the triggers for our site to start tracking scroll depth and session duration, the last thing we need to do is set up tags that fire events based on those triggers into your GA4 property. To do this, go to tags within Google Tag Manager and select “new tag”. There are many different tag configuration options available, but for this one we need to select “Google Analytics 4 Event”.
From here all you need to do is give it an event name that will show up in your actual GA4 property for this event, and select your Google Analytics 4 configuration tag.
Last, select the trigger that you want to use for this tag such as the 60% Scroll Depth one we created in the video.
Your tag setup should look like this:
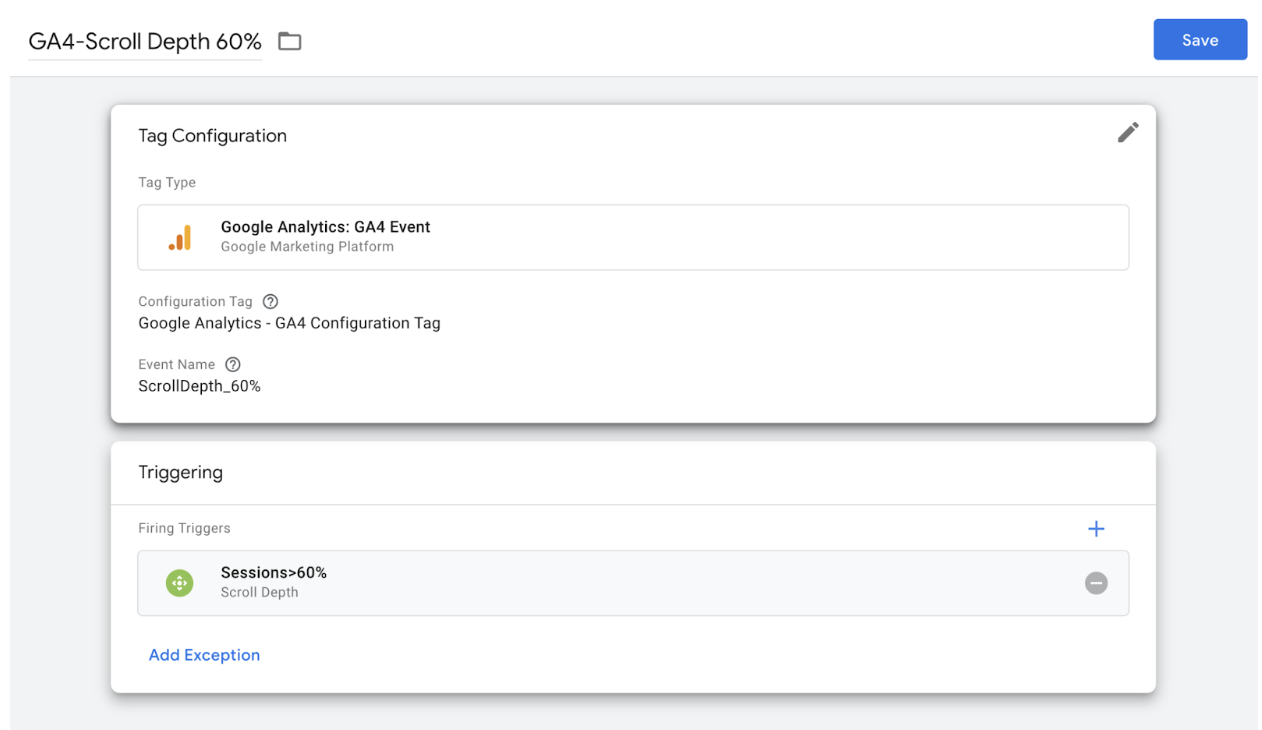
Note: You should be creating a separate trigger/tag for each Scroll Depth/Session duration threshold you want to measure.
Now all that’s left is to hit save, then submit your updates in Google Tag Manager for the events to start firing into your GA4!
Now go take on the world
You have now learned that the date range compare feature is one of your greatest weapons as a marketer, how to make any report give you the exact information that you need to optimize your digital campaigns, and even learned how to set up some fancy custom GA4 events to show off to your boss.
You’re now capable of solving almost any issue possible when it comes to your digital marketing using GA4 (unless you’re not able to upload campaigns because you spilled coffee on your computer).
All that’s left to do is to take this knowledge and run with it.

