Have you ever been watching a great TV show and when one episode ends on a cliffhanger you think to yourself “I can’t wait to find out what happens next”? Google Analytics is that next episode.
You see, platforms like Facebook, LinkedIn and Google offer plenty of insight on how your ads are performing on the platform. But what you need is insight on what users are doing on your site after leaving the ad platforms you’re using.
GA4 offers what those platforms can’t: Showing what happens after they click on your ad.
Part one of this series walked you through some key changes between Universal Analytics and Google Analytics 4. Part two of this series will go over the core metrics in GA4 that can help you analyze your advertising performance, as well as the main reports we use here at Gorilla to help us make informed decisions.
The metrics
Users
This measures the amount of individual people landing on your site whether it be from different platforms, campaigns, etc.
GA4 also breaks this down by new and returning users, which is definitely something to keep an eye on if you’re running retargeting campaigns on paid social/search.
However it is important to mention that due to how the tracking technology works, some users can be labeled as “new” when they are in fact returning if the user uses a different device or clears their browsing history.
The takeaway: pay attention to new and returning users within GA4, but don’t let it be the end all be all when making decisions.
Sessions
Instead of individual people, this focuses on every session on your site. The same user can record as many sessions as they want on your site (this part of how GA4 will calculate new/returning users).
Engaged Sessions/Engagement Rate in GA4 is any session that lasts longer than 10 seconds, results in a conversion event, or has at least 2 pageviews or screenviews (i.e. did they click to multiple pages on your site).
Engagement rate is simply what % of sessions on your site result in an engaged session.
If users aren’t doing that once they click through the ad to your site, it’s likely due to one of the following misalignments:
- Your landing page isn’t appealing to your audience.
- The landing page doesn’t line up well with the content from your ad.
- Your audience doesn’t line up well with the content you are advertising.
Avg. Engagement Time/Avg. Session Duration
Average engagement time is how long your site was the focus of the user’s browser. Session duration is simply how long the average session lasts. Sometimes someone can leave your site open but move to a different window/screen, so engagement time can sometimes be more useful.
If you’re in the B2B space, chances are you have a landing page where the user can learn more about your brand, a product you offer, etc. You just might even have a form on the page where they can give you their information to potentially give your company a lot of money.
Can they read that content or fill out that form instantly? Not possible, unfortunately — so it’s kind of an issue if users aren’t spending time on your site once clicking through your ads.
Average engagement time and session duration are crucial to pay attention to in GA4. If you’re running paid social and paid search ads, your paid search engagement time should be much longer than your paid social ads. If you’re running paid social on both LinkedIn and Facebook, you can expect your LinkedIn engagement time to be longer than Facebook.
Conversions/Events
GA4 automatically creates some basic events such as pageview, first visits, user engagement and more to track on your site. Events are essentially specific actions taken on your site by the user.
So on top of making sure users are taking action on your site through engagement rate mentioned above, this allows you to track what actions they’re taking.
For example if you’re a B2B marketer, form submissions from inbound leads are likely an integral part of your business. Setting these up not only as an event within GA4 but also a conversion event allows you to analyze where your conversions are coming from, but also what other events/pages may be leading to those conversions.
And there are limitless custom events you can set up on your site such as scroll depth, clicking specific buttons on your site, and more. These can give you even more insight on the actions your users are taking on your site (jump ahead to part three of this series to set up these advanced tracking metrics!).
Reports
All of the above metrics can be extremely useful when analyzing your advertising performance to make informed decisions. But what really makes them useful is the different ways you can look at these metrics.
Think of each of these core reports within GA4 as a different “lens” through which you view GA4’s data.
User/Session Acquisition
This report arguably offers the most information on what users from your ad campaigns are doing on your site.
These two reports offer most of the same metrics such as engagement rate, engaged sessions, average engagement time, etc. The main difference is one pulls data based on each individual user, while the other is based on individual sessions.
This report is most useful if you are running campaigns on multiple platforms. Below is what this report looks like, broken down by Session Source.
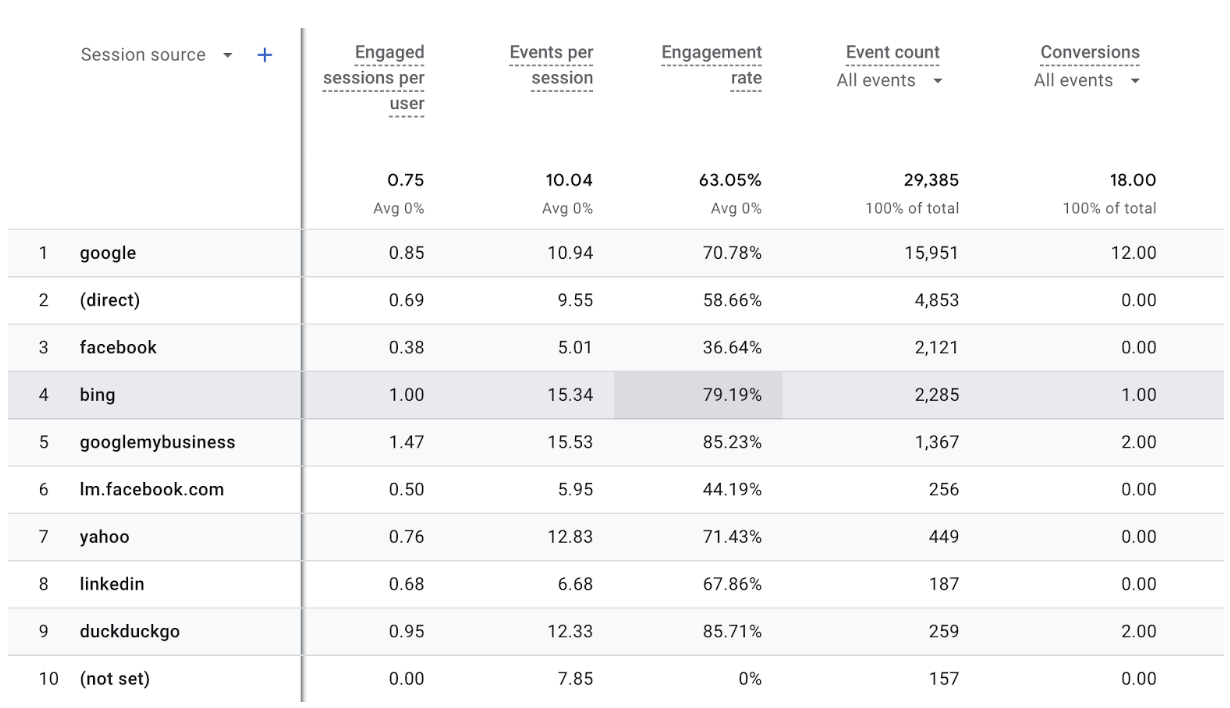
Let’s say you’re running paid social ads on both LinkedIn and Facebook using the same creative assets and messaging. Using these acquisition reports, you notice that although Facebook is driving far more sessions, LinkedIn is generating a higher engagement rate along with more conversions.
If it’s the same creative on the ad and landing page, but the users are behaving drastically different on your site, this can clue you into the differences between audiences on Facebook vs. LinkedIn.
This is just one of many ways you can use the User/Session acquisition report to diagnose issues with your digital campaigns.
Event/Conversion Reports
Similar to the User/Session Acquisition reports, these two reports show a lot of the same information. What makes these so useful is they help you recognize what events “feed” into other events, i.e. do your form submissions result from a high engagement rate, session duration, etc.
You might see here that a lot of your lead conversion events are coming from sessions that occur on a desktop. However other events such as engaged sessions/pageviews are all coming from mobile with few leads coming in. You could be getting all of those pageviews from say, paid social ads.
But if people aren’t converting you may need to take a look at the landing pages for those ads to ensure they are mobile friendly (does the page load fast, is the form easy to find, how well does the page read on your phone, etc.).
Conversion Path Report
If you are running ads on multiple digital channels, this report is one of your best friends.
Hidden away outside of the reports section, the Conversion Paths report is stationed under the Advertising section of GA4.
This report shows you
- What channels are contributing to the beginning, middle, or end of your customer’s journey to becoming a lead
- How many touch points on average it takes in each different “path” for your potential new customer to convert
- Data that can be broken down by channel, source (such as different social media platforms), or even campaign if you’re utilizing UTMs in your ads
Below is what the report can look like broken down by channel.
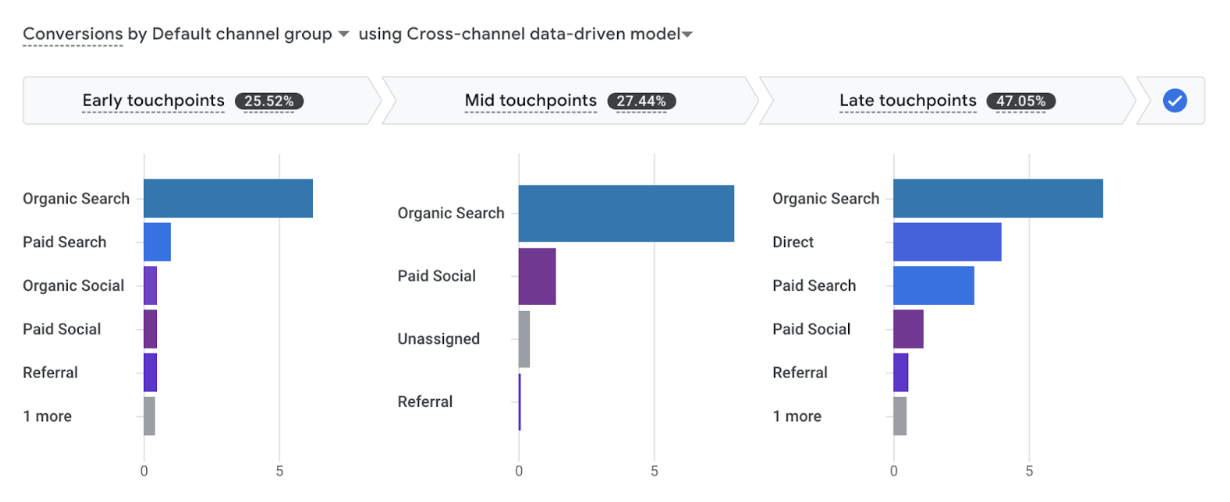
Here’s a potential scenario for you:
If you’re only paying attention to leads coming “directly” from paid social, you risk cutting off a channel that was getting you a ton of traction — it just wasn’t getting all of the credit from good ol’ Google.
Users might be simply searching your company’s website later on to submit their information, even converting through one of your paid search ads. Your well-written LinkedIn ad might be contributing a lot of leads to your pipeline, but none of those lead conversions would “show” as coming from paid social.
Analyze your advertising in a whole new light
If Google Analytics is your digital marketing hospital, these reports/metrics are your tools —and the doctor’s in.
Google Analytics gives you the tools to look at your advertising from almost any angle possible. so you should use it to make the most informed decisions possible for your advertising.
That way you can avoid giving your marketing a misdiagnosis, or pulling the plug on a campaign too early.

